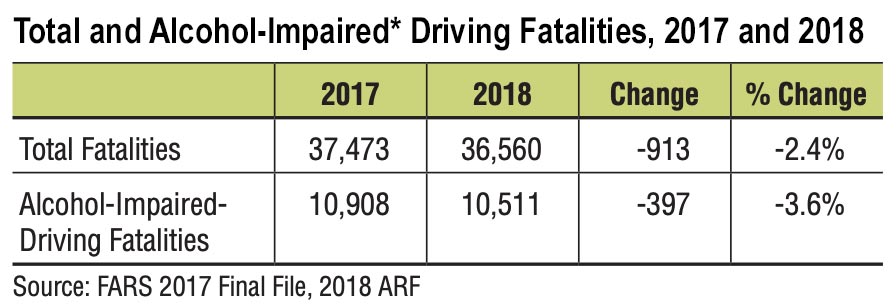
The National Highway Traffic Safety Administration (NHTSA) recently released 2018 data regarding fatal motor vehicle crashes that revealed an encouraging trend. According to the report, the number of people killed in crashes on U.S. roadways has decreased for the second consecutive year. And what’s more, drunk driving fatalities followed suit. In 2018, drinking-related fatalities decreased by 3.6 percent, accounting for 29 percent of overall fatalities—the lowest percentage since 1982, when NHTSA began reporting alcohol data.

Possible Explanations for Reduction in Impaired Driving Fatalities
Since the early 1980s, there has been a general downward trend in traffic fatalities. Safety programs such as those increasing seat belt use and reducing impaired driving are often attributed to this shift. And, while it is still a major issue, the number of fatalities in distraction-affected crashes has begun to decline (down 12.4 percent since 2017).
The Role of Vehicle Advancement
Vehicle improvements such as airbags and electronic stability control have contributed greatly to the reduction of traffic deaths, according to another report from NHTSA. “New vehicles are safer than older ones and when crashes occur, more new vehicles are equipped with advanced technologies that prevent or reduce the severity of crashes,” NHTSA Acting Administrator James Owens said.
Alcohol a Major Factor in Pedestrian Fatalities
While driving fatalities were down, the number of fatalities involving pedestrians and cyclists actually increased, 3.4 percent and 6.3 percent respectively. Both of these categories are the highest they have been since 1990.
The
largest risk factor appears to come from the time of day that the accident
occurred (76 percent took place after dark). Other factors included pedestrians
who were not at intersections (74 percent) and alcohol in the system of the
pedestrian (38 percent). And all these factors are more prominent in urban
areas than in rural.
State Drunk Driving Data
While fatality numbers decreased overall, there were a few states in the U.S. that experienced an increase in drunk driving fatalities. For those that had an increase, many were due to the generally smaller population of that state, such as New Hampshire (+77.8%), Montana (+38.6%), and Alaska (+31.8%). However, more populated states such as Ohio (-10.6%), Michigan (-12.5%) and Illinois (-13.4%), made the biggest impact on the positive trend by reducing the percentages of fatalities within their larger populations. (For the full report of Total and Alcohol-Impaired Driving Fatalities by State for 2017-2018, review page 9 of the NHTSA report)
Forecast for 2019
In addition to the 2018 numbers, NHTSA also released initial estimates for the first half of 2019, which suggest that this overall positive trend may be continuing. According to the report, the estimated number of fatalities in the six months of the year declined by 3.4 percent from the same period in 2018, with 589 fewer fatalities over that time. While final numbers for 2019 won’t be released until well into 2020, the positive movement toward reduction of traffic fatalities—including those involving alcohol—is very encouraging.
